


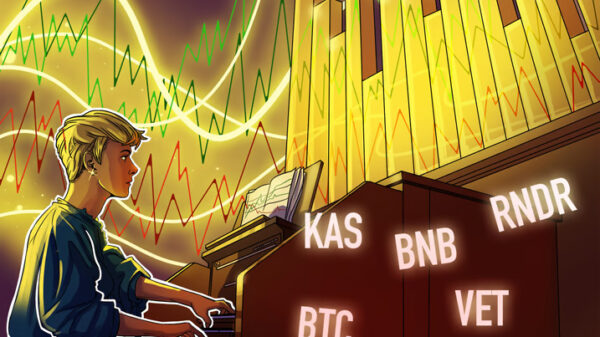


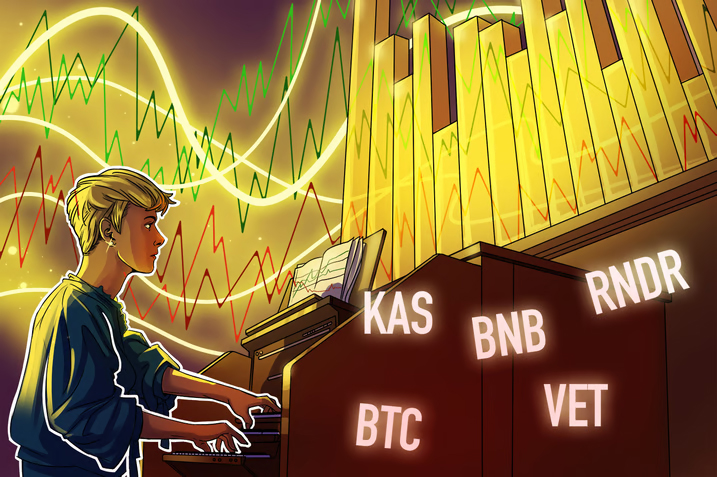
BNB, VET, RNDR, and KAS are showing bullish signals as Bitcoin bulls strive to maintain the $52,000 level.
Bitcoin could face headwinds at $52,000, but BNB, KAS, VET, and RNDR may continue to move higher.
Investments in Bitcoin through exchange-traded funds (ETFs) reached over $2.2 billion from February 12 to February 16, suggesting significant interest from investors. According to Bloomberg analyst Eric Balchunas, BlackRock’s iShares Bitcoin Trust (IBIT) has seen inflows of $5.2 billion year-to-date, accounting for half of BlackRock’s total net ETF flows from 417 ETFs.
Bitcoin extended its upward momentum this week, climbing approximately 7%. However, bullish efforts are encountering strong opposition around the $52,000 mark. One immediate worry revolves around the possibility of bankrupt cryptocurrency lending company Genesis selling off approximately $1.3 billion worth of Grayscale Bitcoin Trust shares to repay creditors.

If Bitcoin stabilizes in the near future, attention may turn to alternative cryptocurrencies. Certain altcoins that have recently surpassed their previous resistance levels could potentially experience a sustained uptrend.
Is it possible for Bitcoin to evade a decline in the near future? If it does, we’ll examine the charts of the top 5 cryptocurrencies that might continue their upward trajectory.
Bitcoin price analysis
Bitcoin has encountered selling pressure around the $52,000 mark. On February 17, bears attempted to push the price below $50,000, but the long lower shadow on the candlestick indicates strong buying interest during dips.

A minor pullback from the $52,000 resistance level suggests that bullish investors are not rushing to take profits, indicating their expectation for the upward trend to persist. If the price successfully surpasses and maintains above $52,000, the BTC/USDT pair may initiate its ascent towards $60,000.
One potential downside to the rally’s continuation is that the relative strength index (RSI) has remained in the overbought zone for an extended period. This suggests that the current upward momentum may be excessive in the short run.
For a corrective phase to begin, the bears need to push the price below the 20-day exponential moving average ($47,809). If successful, the pair could potentially decline towards the 50-day simple moving average ($44,441).

The bears managed to push the price below the 20-period exponential moving average (20-EMA) on the 4-hour chart, but were unable to maintain it at the lower levels. This indicates that the bulls are actively defending this level. To enhance the likelihood of an upward movement to $55,000, buyers will need to overcome the resistance at $52,817.
To thwart further upward movement, bears must push the price below the moving averages. This could lead the pair to plummet to the breakout point at $48,970. Bulls will attempt to defend this level, but if unsuccessful, the pair could drop to $47,000 and eventually to $44,700.
BNB price analysis
BNB’s price is currently down, hovering around $353, despite being in an upward trend. However, the rally is encountering resistance around the significant barrier of $360. One small advantage is that the bulls are holding their ground against the bears.

The upward-sloping 20-day EMA ($328) and the RSI hovering near the overbought zone suggest that the market is inclined towards further upward movement. If buyers successfully push the price above $360, the BNB/USDT pair could initiate its next advance towards $400. While breaking through this level may pose a challenge, surpassing it could potentially lead to a target of $460.
On the flip side, if the price falls below $348 and closes at that level, it may prompt short-term traders to take profits. This could initiate a correction towards the 20-day EMA, followed by a potential decline to the 50-day SMA at $313. A shift in the short-term trend would be indicated if the pair closes below the 50-day SMA.

The bulls are making an effort to protect the 20-EMA on the 4-hour chart, but the bears are persistently applying pressure. Should the price rebound from its current position, the bulls will strive to propel the pair towards $366. A breach above this resistance level would signal the continuation of the uptrend, potentially leading the pair to ascend to $400.
On the other hand, if the price stays below the 20-EMA, it will suggest a resurgence of bearish sentiment. In such a scenario, the pair could decline towards the 50-SMA.
Kaspa price analysis
Kaspa (KAS) surged above the $0.15 overhead resistance on Feb. 17, indicating the resumption of the uptrend.

The upward sloping 20-day EMA at $0.13 indicates an advantage for buyers, but the RSI’s overbought levels suggest that the recent rally may have occurred too quickly. If the price declines from its current position, it is expected to find support around $0.15. A strong bounce from this level will increase the likelihood of a rally towards $0.20.
Conversely, if the price experiences a sharp decline and falls below $0.14, it will indicate a potential end to the uptrend in the short run. In such a scenario, the KAS/USDT pair may drop to the 50-day SMA at $0.11.

On the 4-hour chart, the pair is encountering resistance around $0.17, yet there’s a promising development as the bulls have managed to maintain the price above the 20-EMA. With the moving averages trending upward and the RSI hovering near the overbought territory, buyers seem to have the upper hand. Should the price surpass $0.17, it may pave the way for further upward movement toward $0.20.
Buyers are anticipated to support the area bounded by the 20-EMA and the 50-SMA during any potential pullback. If the price falls below the 50-SMA, it could indicate a resurgence of bearish sentiment.
VeChain price analysis
VeChain, represented by the ticker VET, surged in momentum following its breakthrough above the 50-day SMA ($0.03) on February 12th, signaling robust buying activity from the bulls.

On February 15th, the VET/USDT pair surpassed the overhead resistance at $0.04, indicating the beginning of the next phase of the uptrend. Nevertheless, the extended wick observed on the candlestick of February 16th suggests that the bears are attempting to impede the upward movement around the $0.05 mark.
If buyers maintain their position without significant retreat, the likelihood of the upward trend continuing rises. Should the price achieve a close above $0.05, the pair could potentially surge to $0.07.
In contrast to expectations, if the price persists in declining and drops below $0.04, it will suggest that the bulls are hastily exiting their positions. Subsequently, the pair could decline towards the moving averages.

The bulls are making efforts to halt the pullback, aiming to rebound from the 20-EMA on the 4-hour chart. Should the price reverse course from the current level and surpass $0.05, it will signal that the overall sentiment remains bullish, with traders consistently purchasing during downturns.
On the other hand, if the price falls below the 20-EMA, it would indicate that bulls are booking profits. Should the price stay below the 20-EMA, the pair might drop to the 50-SMA. A more significant decline could postpone the beginning of the next upward movement.
Render price analysis
Render (RNDR) broke and closed above the $5.28 overhead resistance on Feb. 15, indicating the resumption of the uptrend.

On February 17, the bears attempted to push the price below the breakout point, but the bulls successfully defended their position. This suggests that buyers are aiming to turn the $5.28 level into a support level. If they manage to do so, the RNDR/USDT pair may advance towards the pattern target of $7.